Every carrier I have talked to in the last five years has more data than they have ever had. Telemetry from every device on the network, every interface, every optical span, every customer premise. SNMP traps, syslog streams, NETCONF notifications, API feeds from every platform in the OSS/BSS stack. Petabytes of operational data, accumulating around the clock, stored dutifully in whatever data lake or analytics platform the architecture team stood up three or four years ago.
And when the fiber goes down at 2 a.m., none of it is available in time to matter.
This is the central paradox of the modern telecom data environment: the network has never been more instrumented, and the operational team has never been more data-rich — and yet the response to a major fault event still begins with someone manually reading a dashboard, correlating alarms by eye, and making decisions based on what they can see rather than what the data actually says.
The problem is not the data. The problem is where it lives and how fast you can get to it.
What a Data Lake Actually Is, Operationally
The term “data lake” sounds like an asset. In practice, for network operations, it is frequently a liability.
A data lake is an architectural pattern designed for storage and retrospective analysis — a place to accumulate large volumes of data at low cost so that analysts and data scientists can query it later. It is excellent for trend analysis, capacity planning, post-incident review, and the kinds of questions that begin with “what happened over the last six months.” It is not designed for the question that matters most in a live fault event: “what is happening right now, and what should I do about it?”
The latency characteristics of a traditional data lake — even a modern, well-engineered one — are measured in seconds to minutes for complex queries. In a network operations context, that latency is the difference between a fault event that is detected and contained before it cascades and one that has already taken down three downstream services by the time the query returns.
Traditional OSS platforms are built on the same architectural assumption: data is ingested, stored, indexed, and then queried. The operational workflow sits on top of a retrieval model that was never designed for the speed that autonomous response requires. When a storm event floods the network with thousands of simultaneous alarms, a retrieval-based system does not scale to meet the demand. It queues. It slows. In the worst cases, it falls over — at exactly the moment when visibility matters most.
The Dual-Path Problem Nobody Is Talking About
Here is the architectural insight that most carriers have not fully internalized: not all network data has the same operational urgency, and a system that treats all data the same will fail at both ends of the spectrum.
A fiber cut alarm needs to reach the response layer in milliseconds. A capacity trend that informs next quarter’s CapEx planning can wait hours for a deep analytical query to run. These are fundamentally different requirements — and they require fundamentally different architectural paths.
The reason most operational data architectures underperform is that they try to serve both requirements with a single system. The high-urgency real-time data gets routed through a platform designed for batch analytics, which introduces latency. The deep historical analysis gets mixed into the real-time stream, which adds noise. The result is a system that is mediocre at both — too slow for autonomous response, too shallow for meaningful trend analysis.
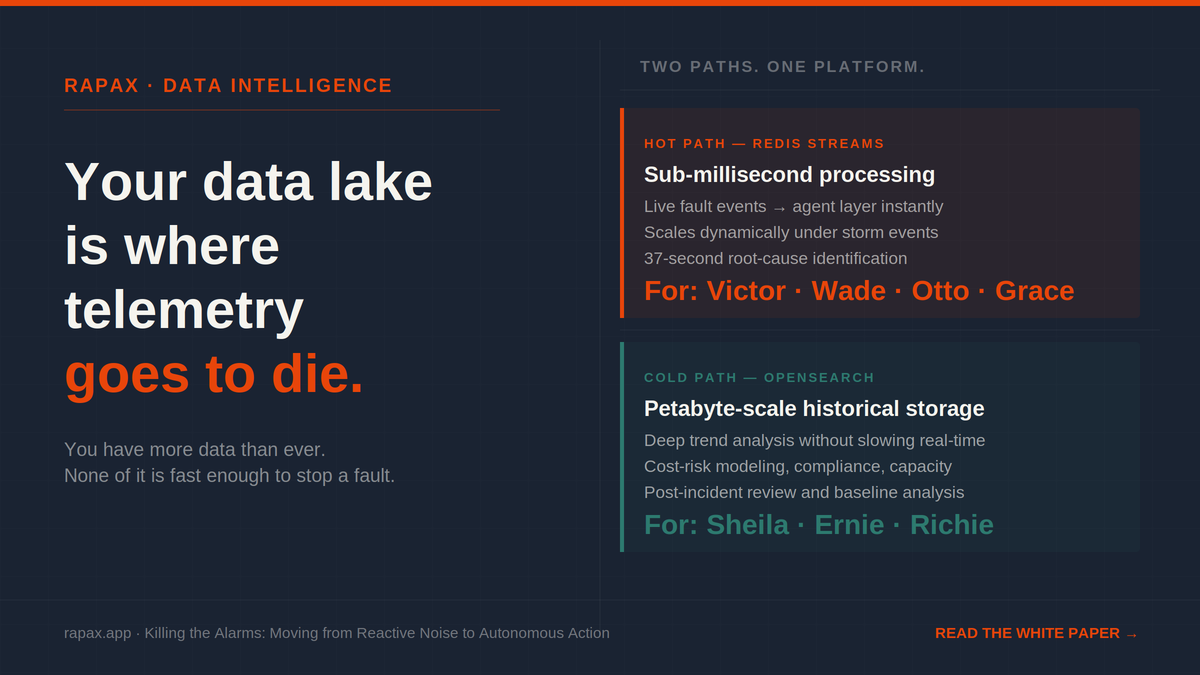
The carriers who are closing the gap between data and action are doing it by separating these paths explicitly. Fast data — streaming telemetry, live alarm events, real-time fault notifications — flows through a hot path designed for sub-millisecond processing. Slow data — historical baselines, trend records, compliance logs, energy utilization patterns — flows through a cold path designed for deep storage and complex analytical queries without competing with the real-time response layer for resources.
This is not a novel architectural idea. It is a well-established pattern in high-performance data engineering. What is novel is applying it rigorously to the telecom operations context — where the stakes of latency are not a slow report but a fiber cut that goes unresolved for an extra 45 minutes because the data fabric could not deliver the signal in time.
What Sub-Second Actually Means in a NOC
The Rapax platform is built on this dual-path model. The hot path runs on a bus — a purpose-built streaming architecture that processes telemetry and alert events in sub-milliseconds, delivering fault signals to the agent layer the moment they arrive from the network. When a fault occurs, Victor, the Incident Controller, receives the event instantly — not after a query, not after a polling cycle, not after a dashboard refresh. Instantly.
The cold path runs on doc store — a distributed search and analytics engine that stores historical operational data and makes it available for the deep trend analysis and cost-risk modeling that agents like Sheila, the Security and Compliance agent, and Ernie, the Energy agent, require to do their work without competing with the real-time response layer for processing capacity.
The result is that when a major storm event floods the network with thousands of simultaneous alarms, the hot path scales to absorb the volume — Rapax uses cloud-native infrastructure, to scale collection and analysis workers dynamically based on real-time demand. The system does not slow down during a mass-outage event. It scales to meet it, automatically, without human intervention.
This is what sub-second activation looks like in practice: a fault event that hits the network is in the agent layer within milliseconds, correlated against the topology within seconds, and producing a remediation recommendation or automated action within 37 seconds — while a traditional OSS platform is still waiting for its first query to return.
The Visibility You Think You Have vs. The Visibility You Actually Have
Most CTOs believe their network is well-monitored because they have a lot of data. I believed the same thing for years, running operations at carriers that had invested heavily in analytics infrastructure. It took a major fault event — one that the data was there to predict but that nobody saw coming because the data was not accessible in the right form at the right time — to understand the distinction between having data and having visibility.
Having data means your systems are collecting telemetry. Having visibility means that telemetry is available to the decision layer — human or automated — in time to change the outcome.
Those are different things. And for most carriers running traditional data lake architectures, the gap between them is measured in the difference between a 37-second autonomous triage and a 45-minute bridge call. Between an SLA that holds and an SLA breach credit. Between an outage that is contained before the customer notices and one that generates a support call and a churn risk.
The data was there. It just could not move fast enough to matter.
The full architecture — how the hot path and cold path work together, how the agent fleet draws on both without interference, and what the deployment model looks like from a regional Tier 3 proof of concept to a Tier 1 multi-datacenter deployment — is in the white paper below.
Download: Killing the Alarms — Moving from Reactive Noise to Autonomous Action →
If any of this lands and you want to talk about what it means for your operation — 15 minutes at cal.com/shawn-ennis. No prep needed.
Leave a Reply